Visualization Composition
As we have seen previously, a builder models user input and represents it by building a RTView. Visualizations produced by builders may be composed with other visualizations. This is particularly useful when two visualizations may be "glued" together to form a complex one.
In essence, the composition of several builders is achieved by sharing a unique view among these builders and properly ordering elements added by each view. The class RTComposer specifically fulfills that purpose.
1. Composing builders
Consider the following example (Figure 1.1):
	data := #(20 30 50 100).

	c := RTComposer new.

	"First visualization"
	g := RTGrapher new.
	g extent: 200 @ 200.
	g view: c view.
	ds := RTData new.
	ds interaction popup.
	ds barShape color: Color blue.
	ds points: data.
	g add: ds.
	g axisX noTick; noLabel.
	g build.
	c group: #graph.

	"Second visualization"
	b := RTPieBuilder new.
	b view: c view.
	b interaction popup.
	b objects: data.
	b slice: #yourself.
	b labeled.
	b build.
	c group: #pie.

	"Layouting"
	c move: #graph onTheLeftOf: #pie.

	RTMetricNormalizer new
		view: c view;
		objects: data;
		distinctColor.

	c view
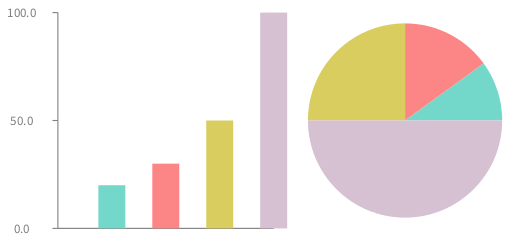
The variable data contains four numbers and represents the input of the script. Two visualizations are composed, using RTGrapher and RTPieBuilder. The variable c represents a composer. The two visualizations are composed of:
- Sharing the view to both builders. This is carried out with
g view: c viewandb view: c view - After invoking
buildon a builder, the composer needs to snapshot the elements and give a name. The expressionc group: #graphgives the name#graphto the elements added byRTGrapher. Similarly, elements added byRTMondrianare named#mondrian. - Adequately positioning elements produced by the builders. The expression
c move: #graph onTheLeftOf: #mondrianperforms this operation.
2. Propagating events
Events may be propagated from one builder to another. The method propagateHighlight defined on the class RTComposer serves this purpose. Consider a slightly different version of the previous script.
	data := #(20 30 50 100).

	c := RTComposer new.

	"First visualization"
	g := RTGrapher new.
	...
	g build.
	c group: #graph.

	"Second visualization"
	b := RTPieBuilder new.
	...
	b build.
	c group: #pie.

	"Layouting"
	c move: #graph onTheLeftOf: #pie.
	c propagateHighlightToAll.

	RTMetricNormalizer new
		view: c view;
		objects: data;
		distinctColor.

	c view
In total, four bars and four squares are represented. Each group contains the model given by the variable data. Using propagateHighlightToAll highlights elements in the view that have the same model. This is useful when elements have to be globally highlighted.
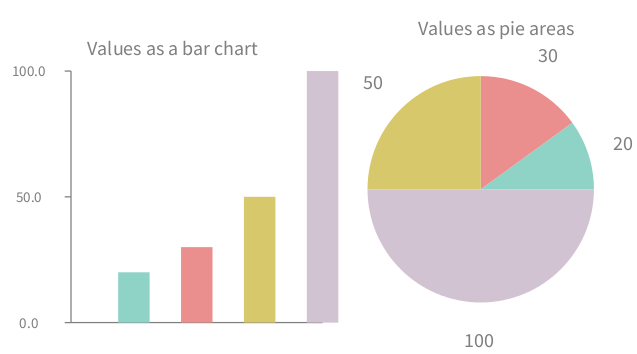
3. Titled visualization
It often happens that visualizations have to be given a title to make the overall picture meaningful. The class RTComposer offers the method nameGroup:as: to set a title to element groups. Consider the extension of the previous script (Figure 3.1):
	...
	"Layouting"
	c move: #graph onTheLeftOf: #pie.

	c nameGroup: #graph as: 'Values as a bar chart'.
	c nameGroup: #pie as: 'Values as pie areas'.

	RTMetricNormalizer new
		view: c view;
		objects: data;
		distinctColor.

	c view
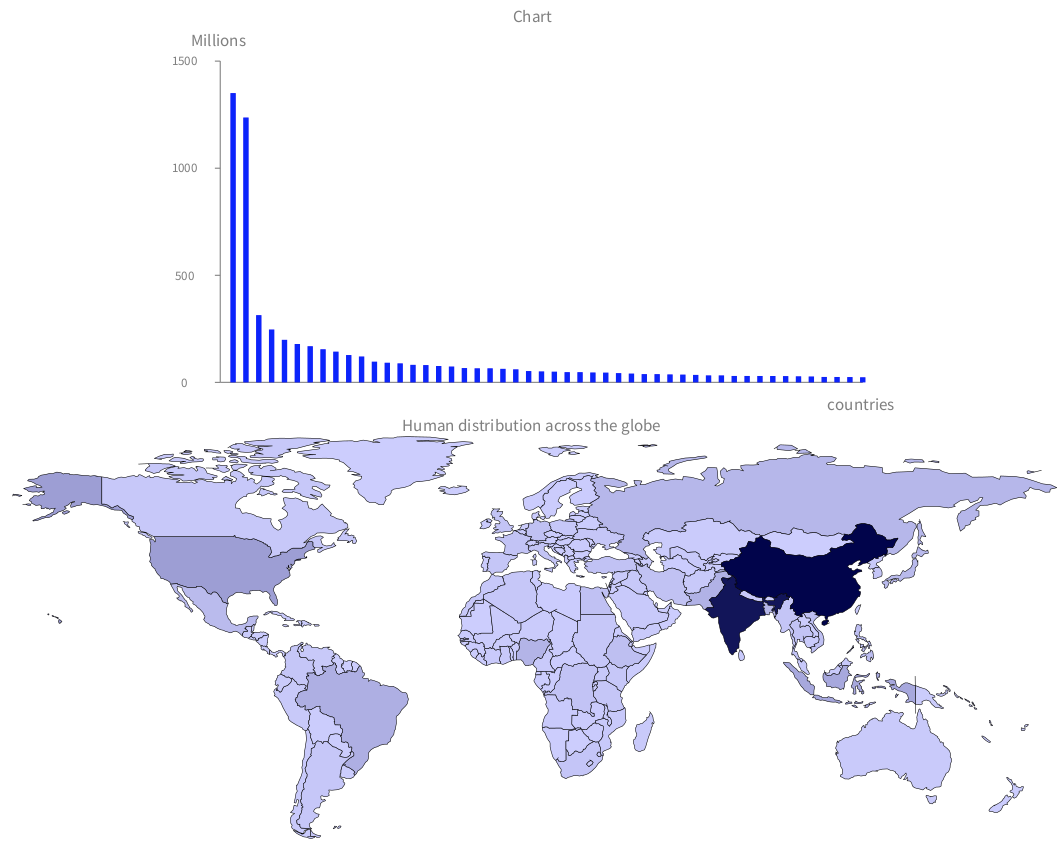
4. World population Example
The following example gives two representation of the World population. Using a geographical map and a bar chart (Figure 4.1):
	composer := RTComposer new.
	v := composer view.

	"========"
	b := RTMapBuilder new.
	b view: v.

	countries := RTMapBuilder countriesPopulation select: [ :c | RTSVGPath countries includes: (c at: 1) ].

	cn := RTNColorLinearNormalizer
		inContext: (countries collect: [:c | c at: 2])
		lowColor: (Color r:0.8 g:0.8 b:1)
		highColor: (Color r:0 g:0 b:0.3).

	b countries: countries named: [ :c | c at: 1 ].
	b color: [ :dic | cn rtValue: (dic at: 2) ].
	b withPopup: [ :c | (c at: 1) asString, ': ',(((c at: 2) / 1000000 asFloat round: 3) asString, ' Million') ].
	b build.
	composer group: #worldMap.

	"========"
	grapher := RTGrapher new.
	grapher extent: 600 @ 300.
	grapher view: v.
	ds := RTData new.
	ds barShape width: 5; color: Color blue.
	ds points: ((countries reverseSortedAs: #second) copyFrom: 1 to: 50).
	ds y: #second.
	ds interaction popupText.
	grapher add: ds.
	grapher axisX noLabel; noTick; title: 'countries'.
	grapher axisY noDecimal; labelConversion: [ :aValue | (aValue / 1000000) round: 2]; title: 'Millions'.
	grapher build.
	composer group: #graph.

	"========"
	composer move: #graph above: #worldMap.

	composer nameGroup: #worldMap as: 'Human distribution across the globe'.
	composer nameGroup: #graph as: 'Chart'.
	composer propagateHighlightToAll.
	v