![]()
![]()
![]()
4.5 Fundamental Queueing ModelWe turn now to the examination of a queueing model which we shall call the fundamental birth-and-death model. This model includes features that are quite general, and as a result, a rather extensive class of well-known and oftenapplied queueing systems can be viewed as simply special cases of the fundamental birth-and-death model. The model assumes a queueing system with m (m = 1, 2, 3, . . .) parallel identical servers and infinite system capacity, operating in the following fashion:
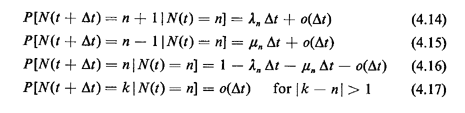
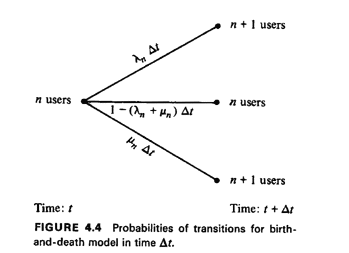
It should be noted that We can now go back to the review of the Poisson process (Section 2.12) and recognize that, if the number of users in the queueing system at a time t is given by N(t), we can write the following conditional probabilities for our fundamental model:
where o(
We can now proceed, as follows. Given (4.14)-(4.17), assuming a
small
Rearranging terms and dividing by
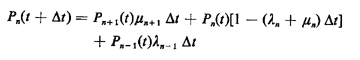
Letting
This equation makes sense intuitively: it states that the rate of
change of the
probability of having exactly n users in the queueing system is
equal to the probability
of exactly n + 1 or n - 1 users in the system at time t multiplied,
respectively, by the
rate at which users leave or enter the system (with n + 1 and n - 1
users present,
respectively) minus the probability that there are n users present
at time t multiplied by
the rate at which the number of users present can either increase
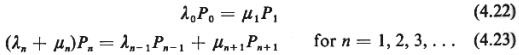
( While (4.20) holds for n = 1, 2, 3, . . . , we also require an equation for n = 0. By following a similar derivation or a similar logical argument as above, we can write
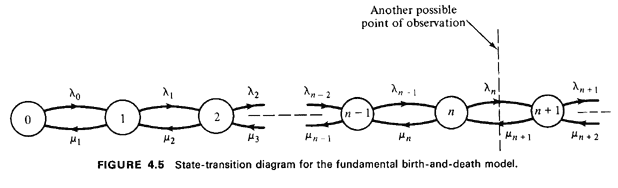
Equations (4.20) and (4.21) together define a set of differential equations, one for each possible value of n, for the queueing system analyzed here. Since, by assumption, the system capacity is infinite, so is the number of first-order differential equations. A pictorial summary of the system of (4.20) and (4.21) is
provided by Figure 4.5. The
status of the queueing system is described by the state variable n
(i.e., the total number
of users in it). Thus, we shall say that the queueing system
"is in state W' whenever
there are n users in the system. Each state is represented by a
circle in Figure 4.5 and
the circles, in turn, are connected by directed links with the
associated transition rate
indicated on each link. Figure 4.5 is thus a typical state
transition diagram for a
queueing system. It is also clear from the diagram why our
fundamental model is referred
to as a birth-and-death model: in population applications of the
model, the state n
represents the "current population" and transitions out of
state n can occur
only to states n + 1 (a birth) and n - 1 (a death) at the rates Continuing with our analysis we can now examine the queueing system when it is in equilibrium (steady state). Under proper conditions, such an equilibrium will be reached after the system has been operating for some time. Equilibrium, in turn, implies that the state probabilities Pn(t) eventually become independent of t and approach a set of constant values Pn, n = 0, 1, 2,. . . , where 4
Since dPn(t)/dt = 0 under these circumstances, in the steady state, (4.20) and (4.21) are then transformed to
The linear equations (4.24) and (4.25) are known as the equilibrium equations or the balance equations for our queueing system. Balance equations [as
|
![]()
![]()
![]()
 (4.18)
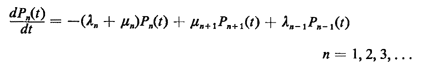 (4.20)