GNU/Linux Desktop Survival Guide
by Graham Williams
|
|
GNU/Linux Desktop Survival Guide by Graham Williams |
|
|||
Walkthrough: Creating Simple Diagrams | 


|
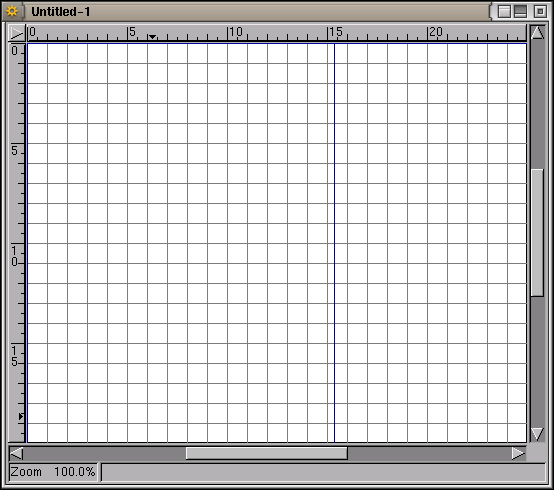
A new diagram is initiated through File-->New Diagram. This will pop up a window containing an empty canvas ready for drawing, similar to that in Figure 24.1.
|
The canvas is decorated with a grid to guide the drawing. The default grid is drawn every centimetre in both directions. Page borders are also shown as blue grids (the darker lines in Figure 24.1). Change the page margins for new diagrams with File-->Page Setup.... Information on the current zoom level is displayed in the lower left.
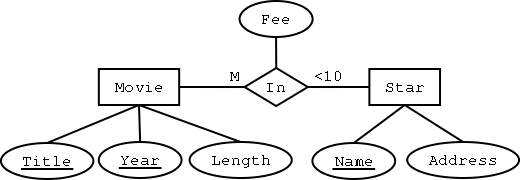
We are ready to create our diagram. A simple entity relationship (or ER) diagram will serve to illustrate the process. An ER diagram illustrates the structure of a database and is an important tool in database design. The basic diagraming elements of an ER diagram are the entity (a rectangle), the relationship (a diamond) and the attribute (an oval). There are variations to each of these that identify different interpretations. These elements are connected with either single or double lines. All these diagramming elements are supplied by the ER sheet.
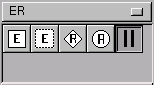
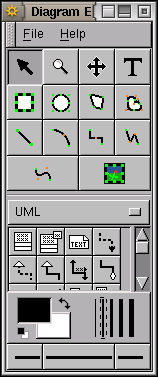
Let's put together a design for a Movies database that will store information about movies and their stars. We have two entities in our database: Movies and Stars. Entities are represented pictorially as rectangles containing text that names the entity. To create the entity Movie click on the Entity button of the ER sheet.
![]()
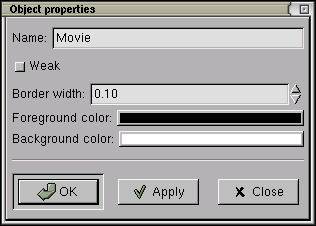
Then move the mouse pointer to the canvas and click again (with the left mouse button) to place a rectangle containing a default label (Entity). You will now want to change the name of the entity to Movie. To do this double click this entity with the left mouse button to bring up the Object properties window. Now double click the word Entity that
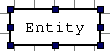
appears in the Name: text field and type Movie. Click the Apply button and you will see the entity name change on the canvas. You can click on OK or Close to close the Object properties window if you wish.
Next we will create the attributes of this entity: a Movie has a Title, the Year in which the movie was made, and the Length of the movie. The procedure for creating attributes is the
same as for all shapes. Select the Attribute tool (the oval) from the ER sheet and click on the canvas where you would like to place the Attribute. Double click this to edit the Object properties to change the Name of the attribute to Title. This attribute is also going to be the attribute by which we uniquely identify every movie in the database. This is called Key, so select the Key checkbox. Click on the OK or Apply button for this change to take effect.
![]()
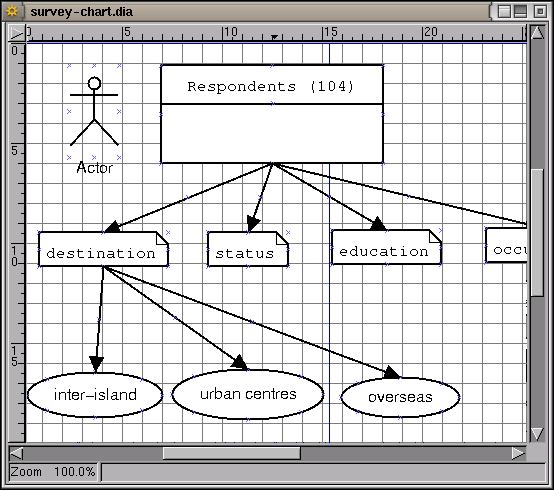
Another diagram (Figure 24.3) uses UML shapes although it is not itself a formal UML diagram.