The default way of interacting with Hudson is the web-based user interface. In addition Hudson ships with web service interfaces, that enable integration with others tools such as integrated development environments. The following section will detail some of these integrations, with links to further tools available on the Hudson wiki.
As a top level Eclipse project it is only fitting that Hudson has great integration with the Eclipse development environment. Historically there are various independently developed integrations that are currently available. Most notably Tasktop's Eclipse Mylyn includes Hudson integration as of release 3.6 and Sonatype provides a Hudson integration as well. Other integrations have mostly stalled and we recommend to use either of these two. Both Sonatype and Tasktop are project members of the Eclipse Hudson project and going forward a merge of the two integrations is planned.
Installation of the Hudson integration is currently with the update site URL https://repository.sonatype.org/content/repositories/forge-sites/m2eclipse-hudson/0.13.0/S/0.13.0.20111015-0033/ following the usual install process. Source code for the integration can be found on github.
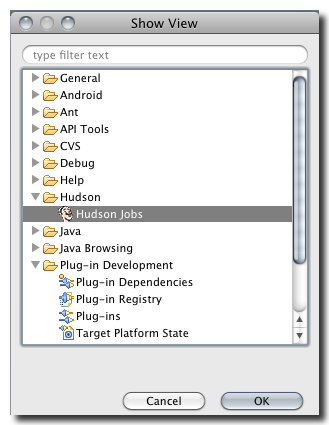
To open up the Hudson Jobs view in Eclipse, go to Window → Show View → Other… . Selecting this menu item will display the dialogue shown in Figure 10.1, “Opening the Hudson Jobs View in Eclipse”.
Once you have selected this Hudson Jobs view, you have to configure the Build Server URL in the Subscribe to Build Notifications dialogue displayed in Figure 10.2, “Subscribe to Build Notifications Dialogue” that can be reached via the blue sphere icon on the top left of the Hudson Jobs view in Figure 10.3, “Hudson Jobs View in Eclipse”.
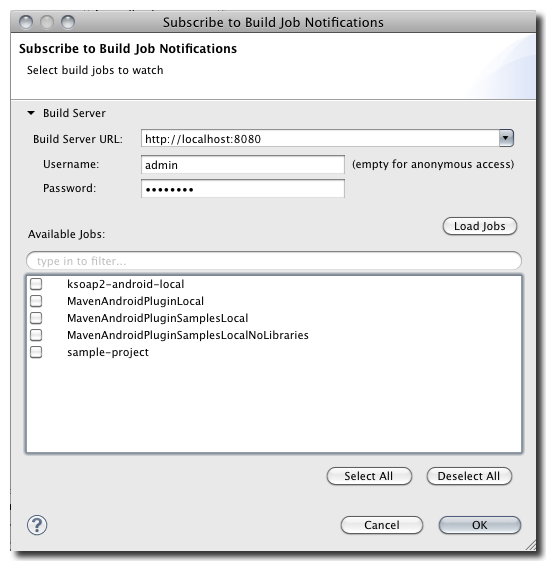
Optionally provide user name and password and then press Load Jobs to have the list of jobs on the bottom of the dialogue populated.
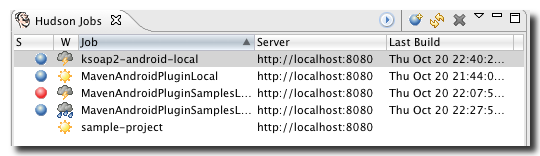
After you select the desired jobs and exit the dialog with OK, you will see the list of jobs in the Hudson Jobs view in Figure 10.3, “Hudson Jobs View in Eclipse”. This list is retrieved directly from Hudson using Hudson REST services. To refresh the list of jobs, click on the refresh icon.
Once you’ve loaded a list of Hudson jobs in Eclipse, you can click on one of these Build Jobs to view a detailed snapshot of the project status and any associated builds like in Figure 10.4, “Hudson Jobs Summary”. In this dialog you can see that the job detail window contains general information about the Job in Job Properties, information about specific Job Builds in Build Properties and also links to alternative configuration for Build Jobs. If you need to get more information about the Job’s workspace in order to trouble shoot a build, you can also click on View job workspace. Clicking on this link will load the project’s workspace in a browser window as another Eclipse tab.
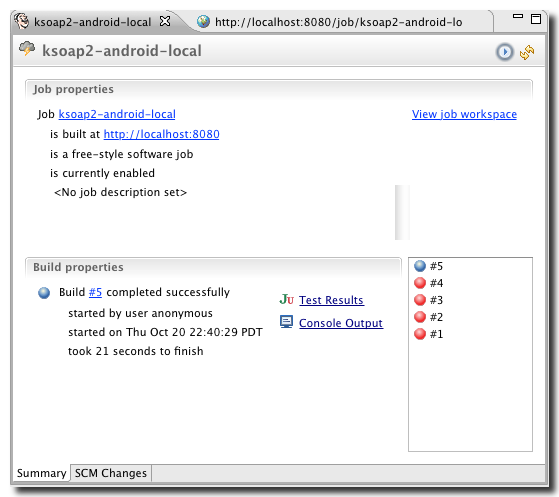
There are some very useful ways in which you can view the results of a build. They are viewing a build’s JUnit test results, viewing the SCM changes associated with a specific build, and viewing a build’s console output. These views of a particular job are the main ways in which you can understand and diagnose issues with continuous integration builds.
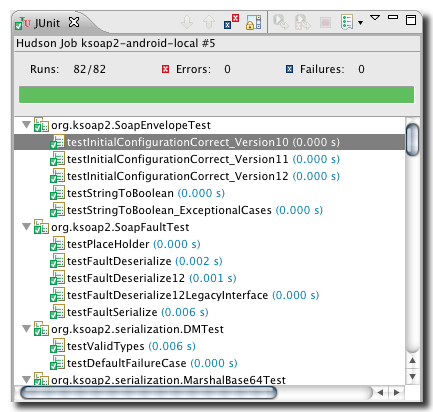
To view a build job’s unit test results, load the job detail page and click on the Test Results link shown in Figure 10.4, “Hudson Jobs Summary”. Clicking on this link will load the view shown in Figure 10.5, “Viewing JUnit Test Reports from Eclipse”. This level of visibility into the continuous integration machine gives you insight into code-level issues happening on a remote build machine without requiring you to exit out of Eclipse and fire up a web browser.
To view a specific build’s SCM changes. Load the project detail view and click on the SCM Changes tab shown in Figure 10.4, “Hudson Jobs Summary”. This particular view of a project combines the changelog of every single build into an easily navigable interface. From that view you can see what code changes trigger individual builds and you can get a sense for what activity and which committer are responsible for build successes and failures.
Viewing a specific build’s console output is often the quickest way to get to the bottom of a build failure. To open a build’s console output, select the project from the Hudson jobs view, select an individual project build, and then click on the Console Output link shown in Figure 10.4, “Hudson Jobs Summary” and you will see the the raw console output from the Hudson build.
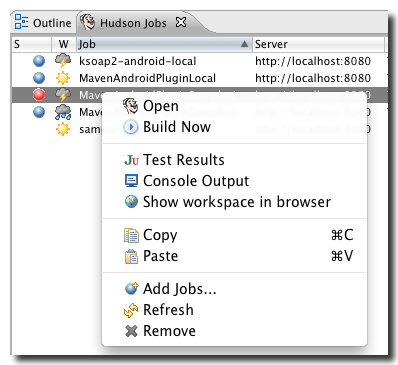
The test results, console output and other features can also be accessed by right clicking on a job in the jobs list view and selecting from the context menu as visible in Figure 10.6, “Contex Menu for a Specific Hudson Job”.
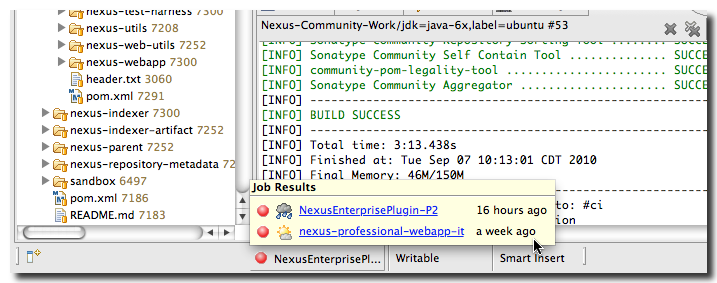
Once you’ve connected Eclipse to Hudson, you can also configure the tool to notify you of build failure events. Figure 10.7, “Hudson Notifications in Eclipse” shows an Eclipse installation which has been configured to receive notifications of specific build failures. Eclipse will periodically poll Hudson to check for build failures.
The Mylyn Builds Connector can be found in the standard update sites that are pre-configured with any Eclipse install.
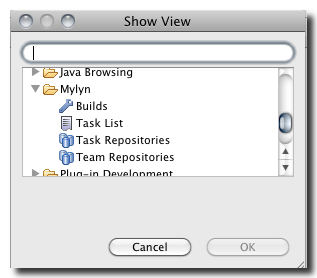
To open up and configure the Builds view in Eclipse, go to Window → Show View → Other…, find the Builds view in the Mylyn section visible in Figure 10.8, “Selecting the Builds View in the Show View Dialog” and click the Create a build server link or the blue New Build Server Location icon.
After selecting Hudson in the wizard you will be able to configure the server in the Hudson Server Properties dialog in Figure 10.9, “Hudson Server Properties Configuration”.
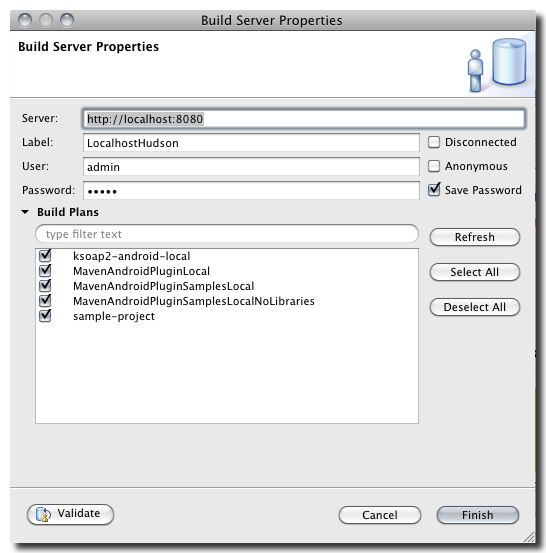
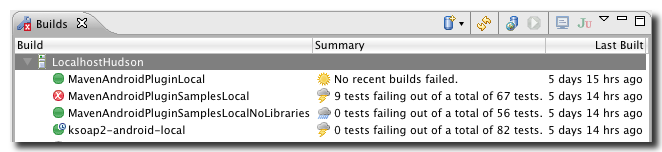
Provide the Server URL, a label and optionally user and password and press Refresh to see a list of available Build Plans. Selecting plans and pressing Finish will close the dialog and show the build plans in the Builds view as visible in Figure 10.10, “Builds List View”.
With the same process you can add further Hudson servers to monitor by pressing on the New Build Server Location button.
If you select a specific plan the icons in the top left corner of the builds view give you access to the job page directly on Hudson in a browser window in Eclipse and the console output and the test results of the last build in an Eclipse windows. You can start another build with the Run Build button.
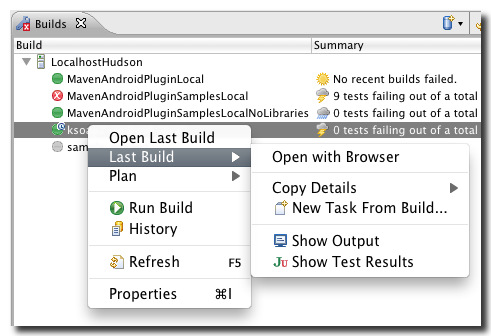
A context menu for each build plan like displayed in Figure 10.11, “Context Menu for an Individual Build Plan” provides access to the build history and integration into the Mylyn task management.
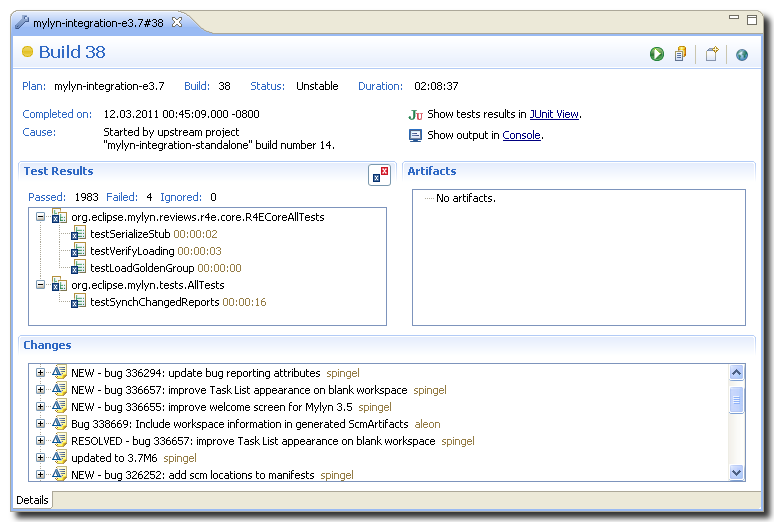
The individual builds overview page visible in Figure 10.12, “Individual Build Overview Display” displays various details about the build and provides access to test results, artifacts, changes and console output with further integration to the task management.
The Oracle JDeveloper Team Productivity Center optionally includes the Hudson Plugin for integration with Hudson in the IDE. The plugin pushed build and test results from Hudson via the Team Productivity Center server to the JDeveloper IDE.
The Netbeans IDE can use the Hudson support plugin to provide integration of Hudson in the IDE.
IntelliJ IDEA users can install the Hudson Build Monitor plugin for integration with Hudson in the IDE.
The Hudson Monitor for Android application or Hudson2Go can be used to access build details on your Android based mobile phone or tablet.
The Firefox Add-on Build Monitor provides access to Hudson as a browser plugin.