Roassal
Material provided in the book is primarily made for Roassal, a visualization engine written in the Pharo programming language.
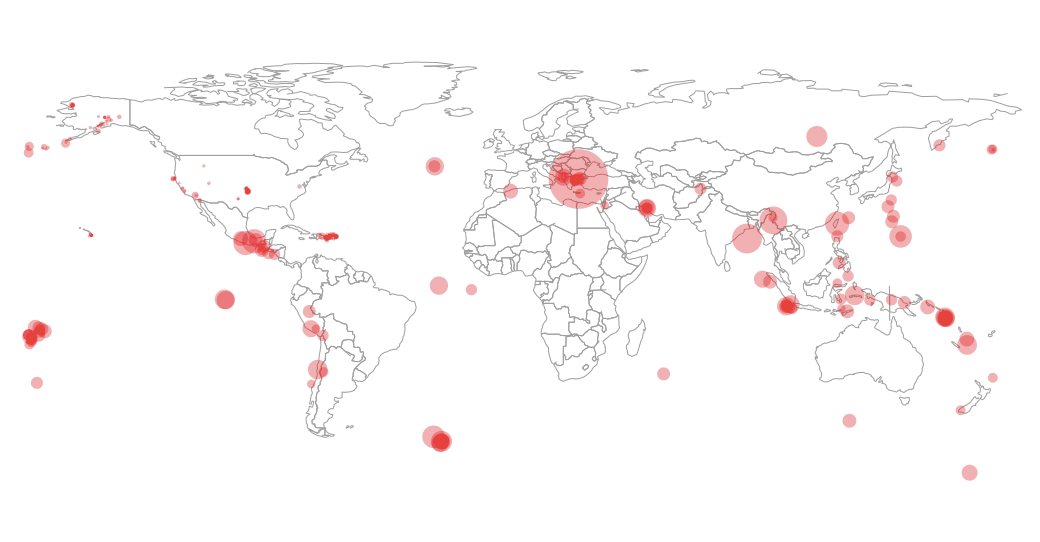
Data Visualization
Roassal is intimate with XML, CSV, JSON. Roassal will make you an empowered data cruncher to paint and paint your data structures at will.
Software Visualization
Many software engineering tasks involves advanced visualization techniques. Roassal, when coupled with Moose, will turn you into a surgeon for software.
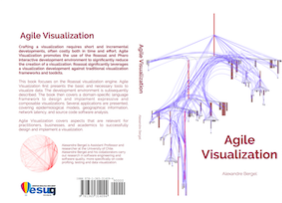
Agile Visualization.
Agile Visualization is about crafting interactive visualizations in extremely short production cycle.
Agile Visualization is made for data scientists, journalists, computer scientists, and software engineers. As soon as you need to process data, numerical or not, Agile Visualization will guide you, step-by-step, to fertilize your data.
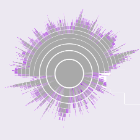
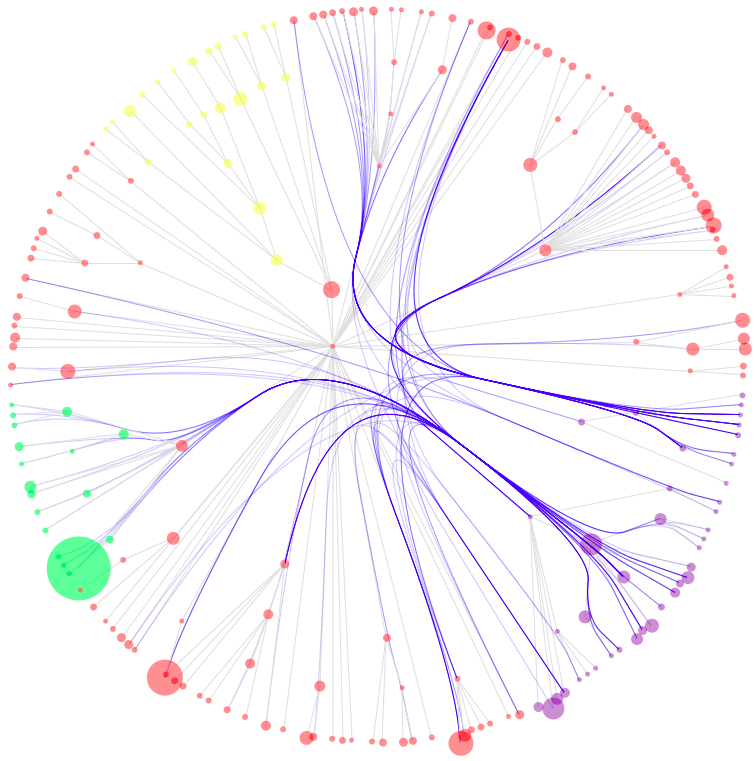
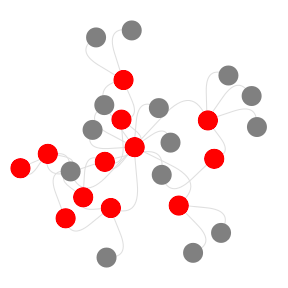
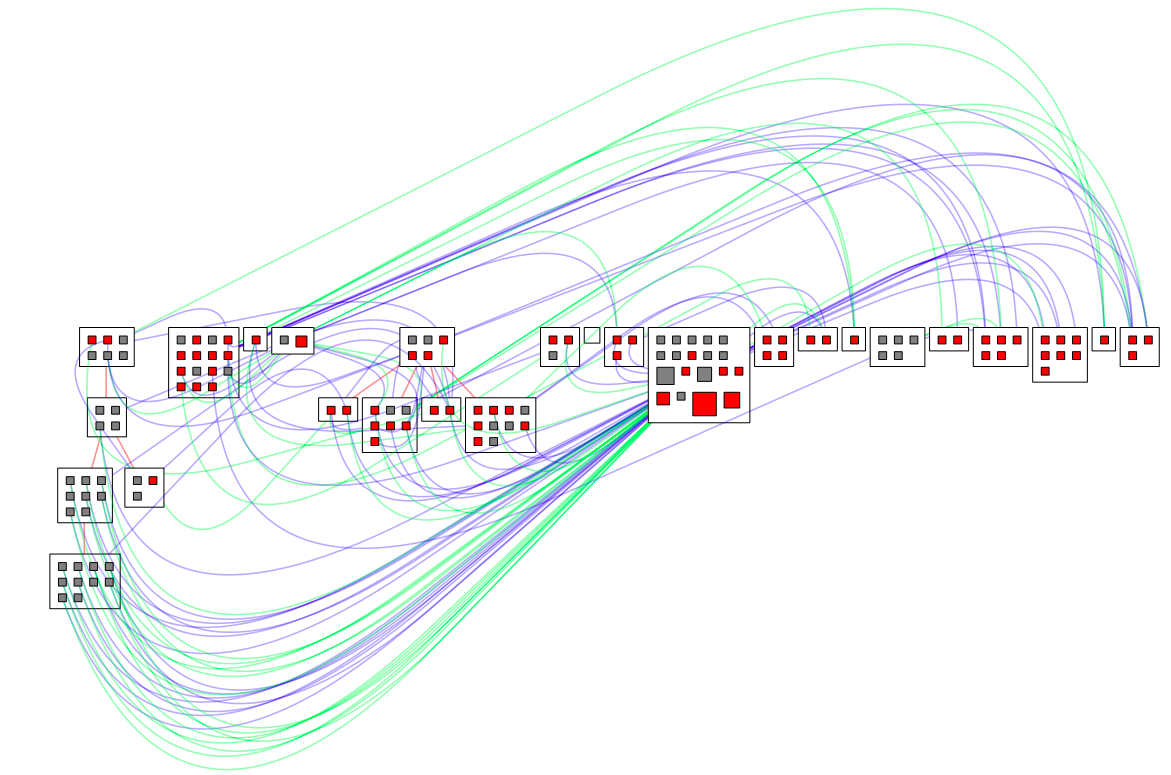
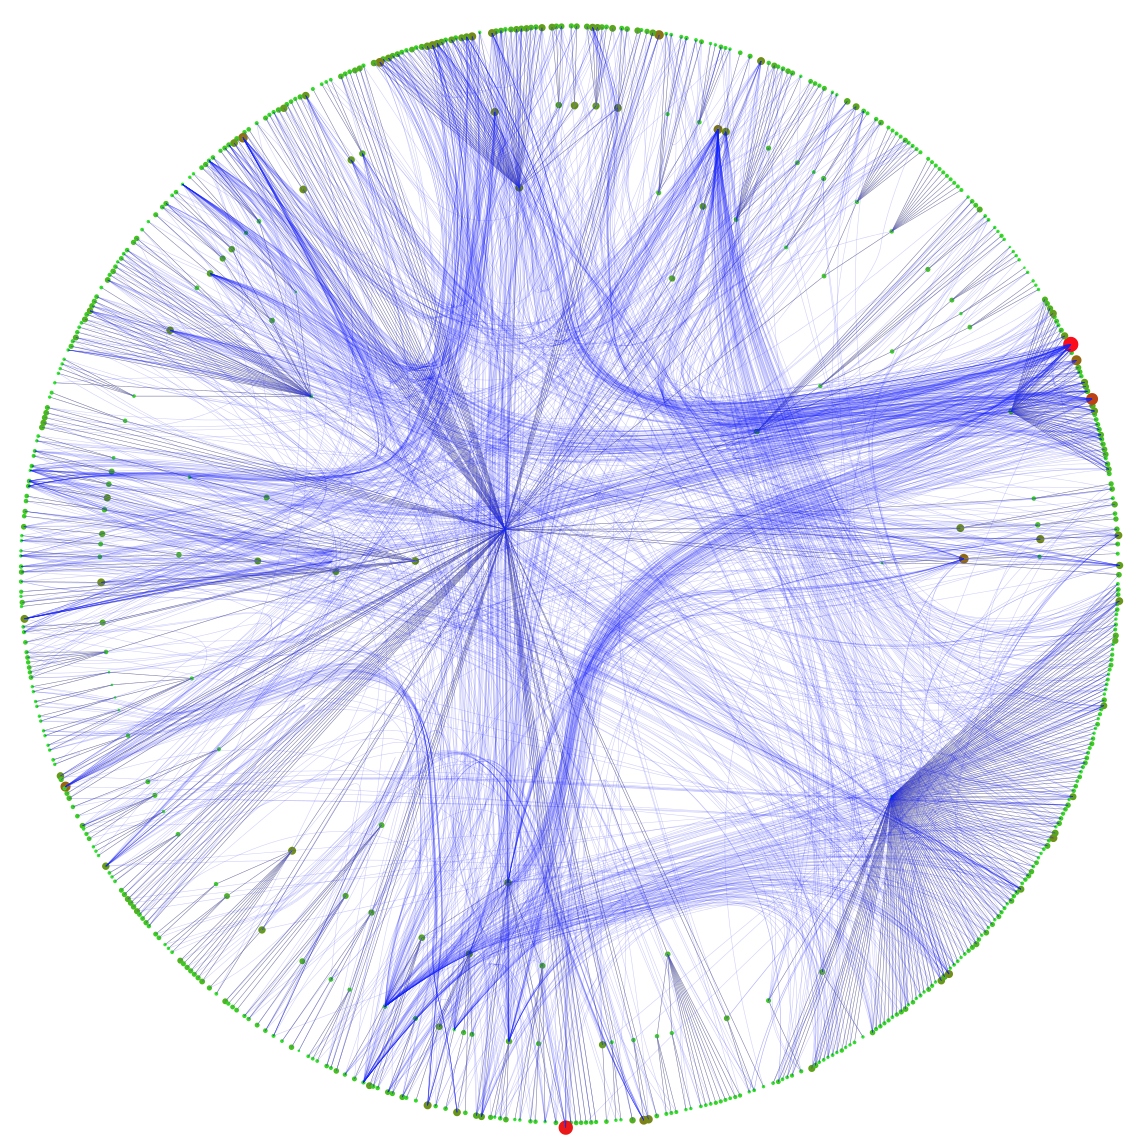
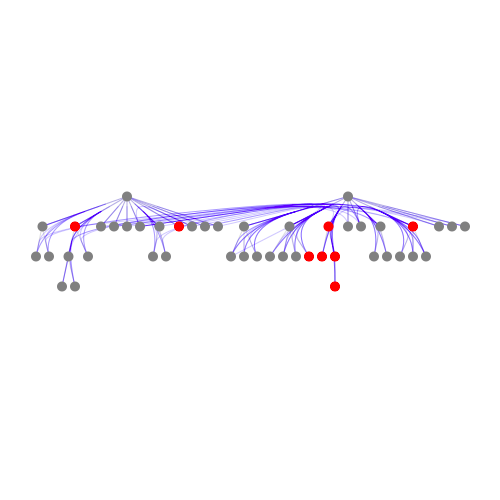
Many examples of what Roassal is up to are browsable online (objectprofile.com/examples). Each example gives a visualization and the source code below.
Book outline.
Agile Visualization may be purchased online (paperback, eBook)
A flyer is also available
Part 0 - Before the feast
- Introduction - HTML
Part I - Roassal
- Quick Start - HTML
- Pharo in a Nutshell - HTML
- Painting with Trachel - HTML
- Visualizing with Roassal - HTML
- Coloring - HTML
- Applying Layout - HTML
- Defining Interaction - HTML
Part II - Builders
- Domain-Specific Visualization Made Easy with Builders - HTML
- Visualizing Polymetric Graphs using Mondrian - HTML
- Charting, Plotting and Curving using Grapher - HTML
- Documenting with a Legend - HTML
- Visualization Composition - HTML
Part III - Applications
Download & Copyright.
The stable version is avaible as a one-click experience (Window, OSX, Linux). This is all you need.
Roassal is an essential component of Moose, a platform for data and software analysis (which is why Roassal is distributed as a ).
Roassal into action (more videos are available on the Moose website):
Roassal is distributed under the MIT license, which means you are allowed to use it in commercial and non-commercial activities. In case you use Roassal in a commercial project, we would greatly appreciate donnations and / or indicate you are a Roassal user by mentioning AgileVisualization.com site and displaying the Roassal logo in your artifact (website and software program).
How to reach us.
Our readers have had and will have a tremendous impact on the book. We always welcome feedback and comments. Material described in the book is regularly the topic of intense discussion. You can reach us via multiple channels:
- Email us
- Join us in the Moose mailing list to discuss about Roassal and the Moose platform. The Pharo language has a dedicated mailing list
- We have an active team at Slack for Roassal and Pharo users. Because it is invite only, you can request your invite by clicking the following badge . Once logged in, join the #Roassal channel.
- Many screenshots, tips, and experiences are shared via Twitter: Follow @ObjectProfile
- Intense discussion also happens on Facebook
- We are physically based in Santiago, Chile. You can give us a ring to +56 9 913 123 81.
Thanks to all of you.
Agile Visualization is supported by open-source communites, research laboratories, and companies. Thanks to all of you! In particular, we thanks Object Profile, Lam Research, RMoD, Synectique, Commissariat à l'Énergie Atomique et aux Énergies Alternatives (CEA), Komponentenwerkstatt.
Agile Visualization is written using Pillar and Skeleton. Thanks Damien Cassou and Yuriy Tymchuk (Uko) for these wonderful frameworks.
We are deeply grateful to for their contributions to (no particular order) CH Huang, Chris Thorgrimsson, Tudor Gîrba, Renato Cerro, Stéphane Ducasse, Yuriy Tymchuk, Natalia Tymchuk, Juraj Kubelka, Juan Pablo Sandoval Alcocer, Milton Mamani, Vanessa Peña, Ronie Saldago, Alvaro Jose Peralta, Pablo Estefo, Igor Stasenko, Faviola Molina, Ricardo Jacas, Daniel Aviv Notario, Sergio Maass, Serge Stinckwich, Bui Thi Mai Anh, Johan Fabry, Nicolai Hess, Miguel Campusano, Peter Uhnák, Martin Dias, Jan Blizničenko, Samir Saleh, Leonel Merino, Volkert, Pierre Chanson, Andrei Chis, Thomas Brodt, Mathieu Dehouck, Miguel Campusano, Onil Goubier, Thierry Goubier, Esteban Maringolo, Alejandro Infante, Philippe Back, Stefan Reichhart, Ronie Salgado, Steffen Märcker, Offray Vladimir Luna Cárdenas, Alena Beyer.
The open-source communities behind Pharo and Moose have always been a great source of wisdom. We are happy to see Agile Visualization a result of your intense energy!
What our readers say.
@ObjectProfile Congratulations! A great team behind a wonderful and really needed agile platform for #DataViz with #LiveCoding. Refreshing!
— Offray Vladimir Luna (@offrayLC) August 14, 2016
@SergeStinckwich @ObjectProfile Very impressed by the way graphs are used for research on software quality
— Melatagia Paulin (@melatagia) August 30, 2016
@ObjectProfile congrats for this wonderful book !
— Serge Stinckwich (@SergeStinckwich) August 14, 2016
Software visualization of Project Malmo, Microsoft's #OpenSource #AI research platform. #Roassal #AgileVisualization pic.twitter.com/gAxZv6b2Na
— brackendev (@brackendev) August 11, 2016